財務ハイライト
財務諸表
(百万円)
| FY20/9 | FY21/9 | FY22/9 | FY23/9 | FY24/9 | FY25/9 | FY26/9 通期 業績予想 | |
|---|---|---|---|---|---|---|---|
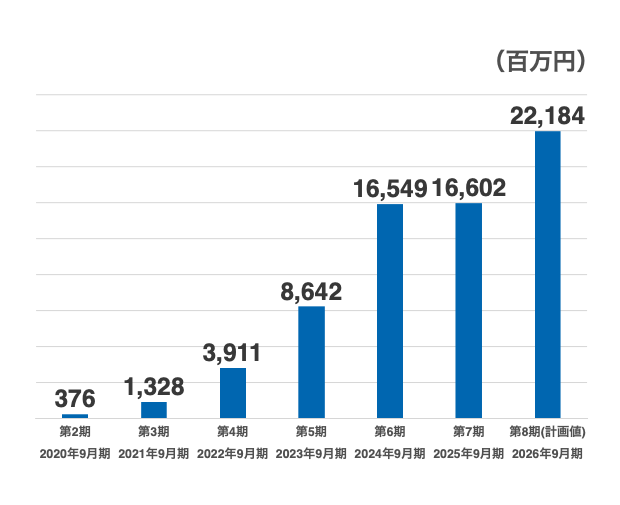
| 売上高 | 376 | 1,328 | 3,911 | 8,642 | 16,549 | 16,602 | 22,184 |
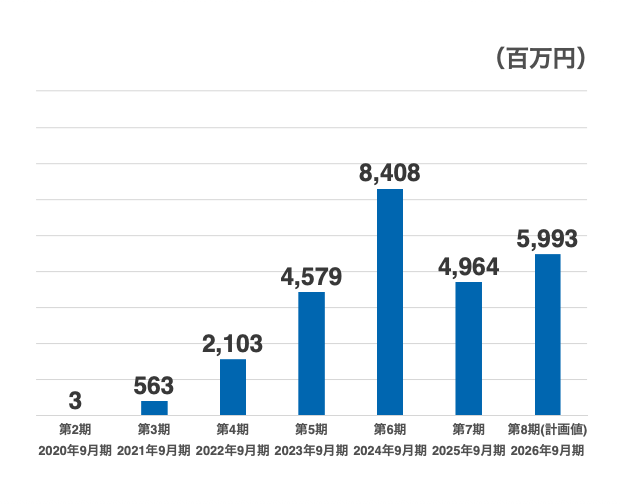
| 営業利益 | 3 | 563 | 2,103 | 4,579 | 8,408 | 4,964 | 5,993 |
| 営業利益率(%) | 1.9 | 42.3 | 53.8 | 53.0 | 50.8 | 29.9 | 27.0 |
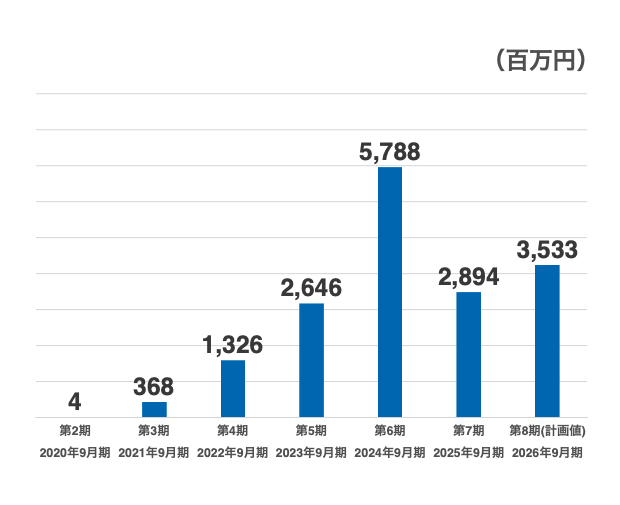
| 当期純利益 | 4 | 368 | 1,326 | 2,646 | 5,788 | 2,894 | 3,533 |
| 当期純利益率(%) | 1.1 | 27.7 | 33.9 | 30.6 | 35.0 | 17.4 | 15.9 |
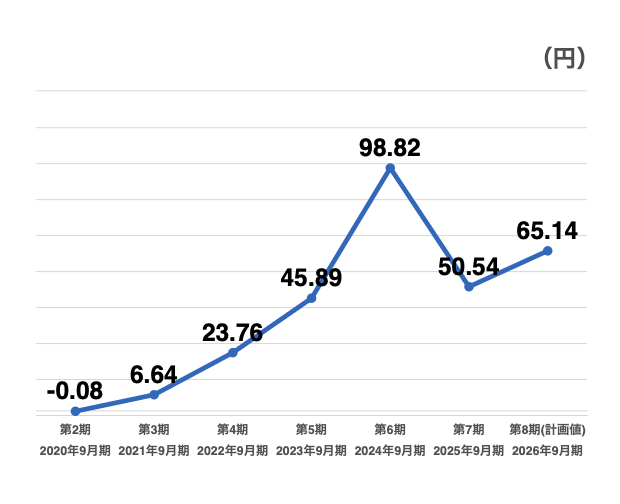
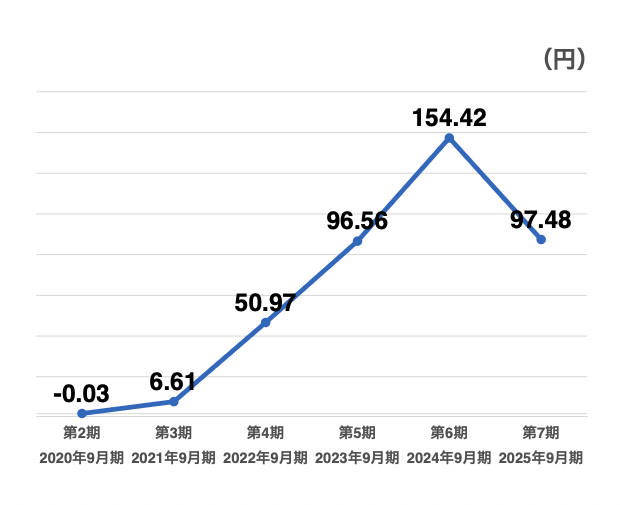
| 1株当たり当期純利益 又は当期純損失 | 0.08 | 6.64 | 23.76 | 45.89 | 98.32 | 50.54 | 65.14 |
業績推移
売上高
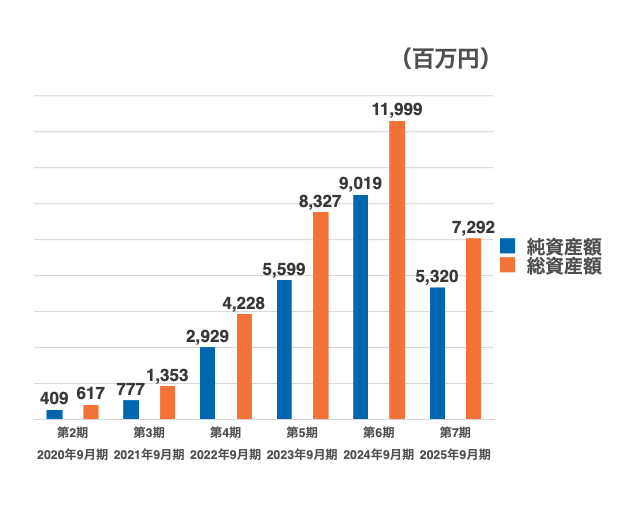
純資産額/総資産額
営業利益
1株当たり純資産額
当期純利益
又は当期純損失
1株当たり当期純利益
又は当期純損失